
How do you make your courses more engaging and effective?
Use Interactive Charts & Graphs.
It’s been a while, but after a long hiatus I’ve been able to spend some quality time on more of the great e-learning challenges David Anderson at Articulate.com has put together. I’m sure I’ve mentioned it before, but if you’re looking for some mini projects to sharpen your skills I highly recommend checking out the e-learning challenges at https://community.articulate.com. The challenge I worked on for this week is #64: Using Interactive Charts & Graphs.
When the time comes to make sense of data, there are few alternatives that work better than a solid chart or graph. And while the terms chart and graph tend to be interchangeable, for our purposes let’s make a clear distinction. A chart (ie. pie chart, etc.) is great at showing the frequency of data at a given point in time. Say, a household’s spending categories by percentage in a given year. A graph (ie. line graph, etc.) is better at showing the relationship between two or more variables and how those variables change–often over time. Using the household again as an example, a line graph could show the change in spending for groceries over the course of the year.
Charts and graphs are great tools for organizing and presenting content, but good e-learning developers look to create opportunities for learners to engage with content. Even simple interactions can make a big difference, because they force the learner to switch from a passive to active role. Learners are doing something, which keeps their interest and helps with retention.
For this week’s challenge I jumped back and forth between wanting to create a slightly more complex slider interaction to dynamically show data changes versus using rollovers to illustrate important data points along a line graph. I decided to go with the rollover idea because it fit better with the data in the graph I was trying to explain. The interactions for this course are pretty straightforward to develop in Storyline (click the link to download the Storyline file: Uncanny Valley Challenge).
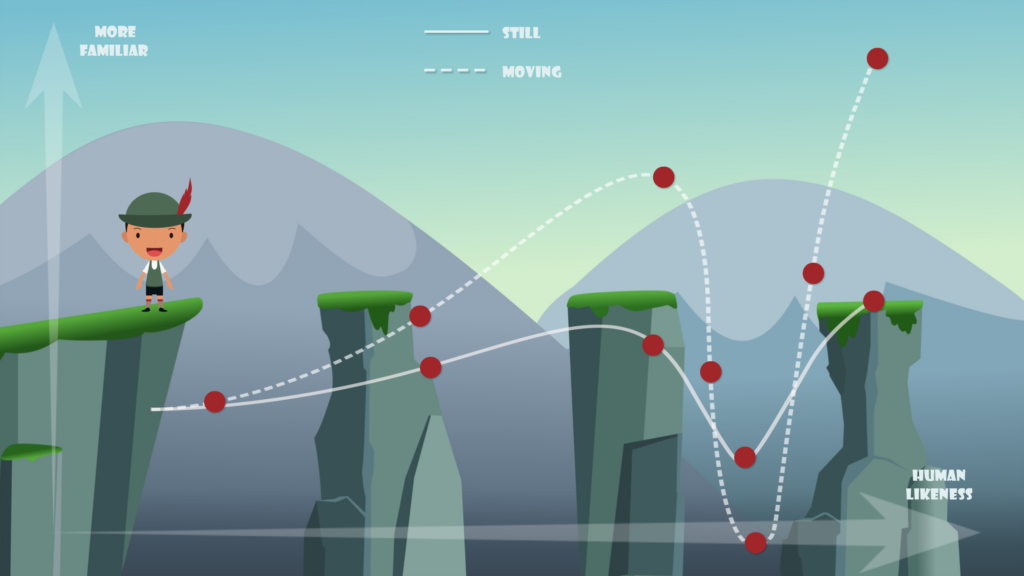
This graph illustrates the concept of the “Uncanny Valley”. The Uncanny Valley is a concept that you’re probably familiar with, even if you’ve never heard the term. It refers to that eerie feeling you get when you look at something like a talking baby doll. When comparing something’s familiarity with its human likeness, there comes a point at which something’s human likeness becomes close, but not close enough. When that happens, it creeps us out and we tend to reject the ‘something’ pretty strongly. For example, compare a “Tickle Me Elmo” with a “Baby Alive” doll. Which one would you rather punt across the living room first?
The emotional effects of the Uncanny Valley present real issues that designers and developers need to navigate around–especially in fields like game design and robotics (the Uncanny Valley term was actually coined by a roboticist). E-learning developers aren’t immune to its effects either, especially as simulations become more and more sophisticated. The implications could affect the overall success of your course. If your characters aren’t believable (or are downright spooky looking), what do you think the indirect effect on your learners’ engagement will be?
(Background image for the course is courtesy of matty4z at deviantart.com, and is used only with permission)